Ferroelectrics

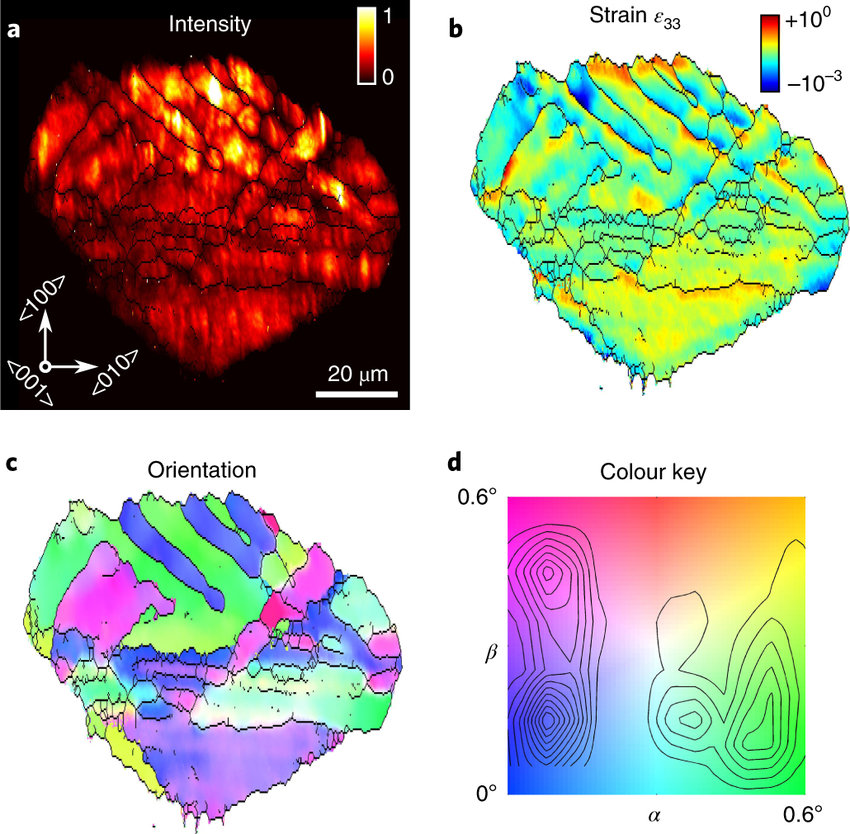
On the image are shown cross-sectional dark-field X-ray maps from the article in Nature Long-range symmetry breaking in embedded ferroelectrics.by Simons, Hugh & Haugen, Astri & Jakobsen, Anders & Schmidt, Søren & Stöhr, Frederik & Majkut, Marta & Detlefs, Carsten & Daniels, John & Damjanovic, Dragan & Poulsen, Henning (2018). Individual domains are visible in the integrated intensity image (a), while the reconstructed strain (b) and lattice orientation (c) maps reveal the structural relationship between domain clusters. d, Local orientation is read from the colour key, where the integrated diffraction intensity distribution is superimposed as a contour map. Boundaries (black lines) in a, b and c are defined by local orientation gradients exceeding 0.5° µm⁻¹.