Amorphous materials
Amorphous materials, such as oxide and metallic glasses, can potentially be applied much more widely than is done today. For example, as construction materials for entire buildings. However, this potential is seriously limited by their well-known brittleness. To overcome this challenge, the first step is to understand, at various scales, the structural changes occurring during fracture under high local stress. The typically used methods to analyze glass structure, such as NMR, are limited to atomic and nanoscale and are not able to solve the central scientific question. This is because residual stresses develop and strength-limiting cracks propagate over long distances as soon as glass surfaces interact mechanically with the environment. Within SOLID we propose to tackle this problem by combining expertise in glass chemistry, mechanics, and dynamics as well as X-ray and neutron imaging. Data collected at ESS and MAX IV will enable us to characterize deformation mechanisms on all relevant length scales and map the complete strain tensor with high resolution. This will lead to improved models of deformation in amorphous materials and thus enable a breakthrough in the bottom-up design of new chemical compositions and structures that allow for plastic deformation without fracture.
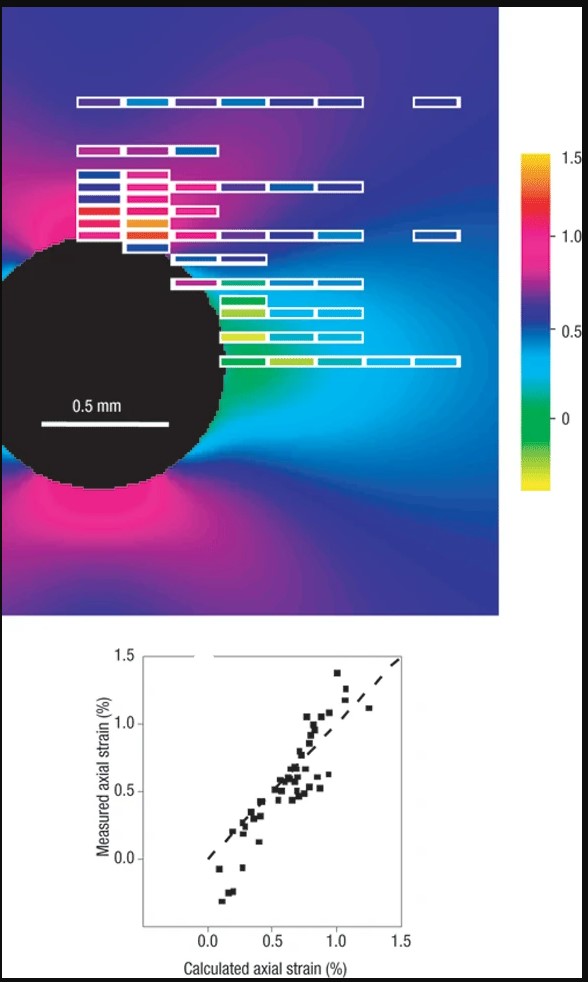
On the Figure are shown the results achieved for the Nature article Measuring strain distributions in amorphous materials by Poulsen, H.F. & Wert, John & Neuefeind, Joerg & Honkimäki, Veijo & Daymond, Mark (2005). The axial strain field around a circular hole in a 2-mm-thick plate of BMG at a compressive stress of 390 MPa acting in the horizontal direction. Shown are the results from the X-ray diffraction experiment (boxes) as well as the result of an analytical model (background), both with reference to the colour code to the right (lattice strain in %). The size of the boxes indicates the size of the X-ray beam: 50 × 200 μm2. In the graph, measured and modelled strains are plotted with respect to each other